More Remarkable Statistics In The Lucy Letby Case
The Poisson probability distribution sheds more light on the Lucy Letby case
I am not a lawyer. Nor am I a medical expert. But I have what I think is a decent grounding in statistical analysis which permits me a useful perspective in relation to so-called ‘cluster cases’, legal cases (often pertaining to the medical world) where there is an unusually high number of events (e.g. deaths of patients) that is deemed suspicious (the Lucy Letby case in which she is accused of murdering 7 neonatal babies on the HDU (high dependency unit) at the Countess of Chester Hospital and attempting to murder a further 10 on 15 occasions is such a case). The probability distribution known as the Poisson distribution is particularly useful in such cases and in Letby’s case yields some remarkable findings.
What is the Poisson distribution?
The Poisson distribution describes the distribution of rare events (in time or space) where events are unrelated to each other and the likelihood of an event occurring (in a unit of time or space) is fixed.
Real world examples of events that are ‘approximately Poisson distributed’ (‘perfect’ does not exist in the real world) are the number of calls received by a call centre in one minute, the number of stars that can be seen through a telescope, the number of zircon crystals in a cubic inch of sand, the number of radioactive decays per second (note that stars and zircon crystals are ‘events’ in space while telephone calls and radioactive decays are events in time).
If, based on historical average, the likely number of calls received by a call centre in one minute is 1.2 (among the millions of telephones from which calls could be received i.e. rare) then the probabilities of receiving 0, 1, 2, 3, etc in one minute can be calculated using a mathematical formula (see https://en.wikipedia.org/wiki/Poisson_distribution), and are as below:
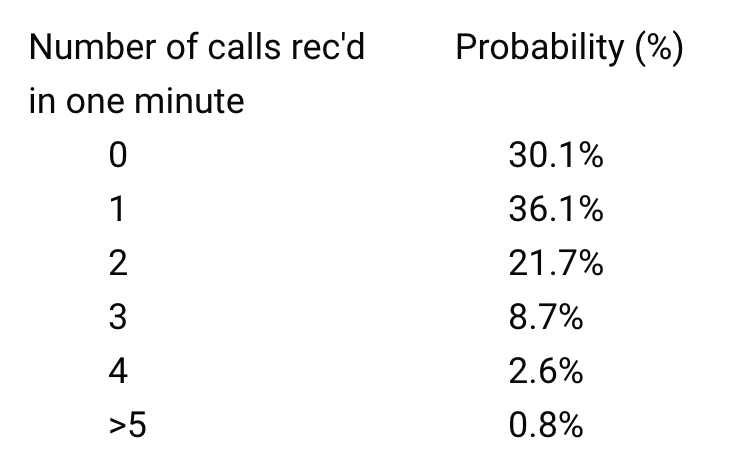
Exactly the same probabilities would pertain in the case of zircon crystals where the average number in a cubic inch of sand was 1.2 (among the hundreds of thousands of grains of sand i.e. rare). Or 1.2 radioactive decays (among billions and billions of atoms) or 1.2 stars in the viewfinder of a telescope (that could contain many more). Cool, huh?
In relation to neonatal deaths (which thankfully are rare) you might expect the number per year (at a hospital, in a particular region, or the country) to decline over time given improvements in care, but the improvement will not be rapid (the rate for England as a whole improved from 1.28 per year per 1,000 live births in 2013 to 0.97 in 2020, a rate of 4% per annum – see MBRRACE UK Perinatal Surveillance Reports 2013 to 2020 on https://www.npeu.ox.ac.uk). So the likely number per year can be considered fixed. And neonatal deaths are going to be independent of each other (the condition of a particular baby is unrelated to the condition of another).
So, neonatal deaths are going to be approximately Poisson distributed. Unless, that is, there is something else going on that is influencing things e.g. the presence of a serial killer, a staff shortage, poor medical care, or contamination of some sort.
Lucy Letby was charged with 7 murders during a 13 month period: 3 in June 2015, 1 in August 2015, 1 in October 2015, and 2 in June 2016 though, strangely, there was no record of the deaths in August and October 2015 in the hospital’s official records (see https://www.whatdotheyknow.com/request/521287/response/1255362/attach/3/FOI%204568.docx?cookie_passthrough=1).
The hospital’s neonatal deaths data can be combined with the information pertaining to the murder charges in the chart below.
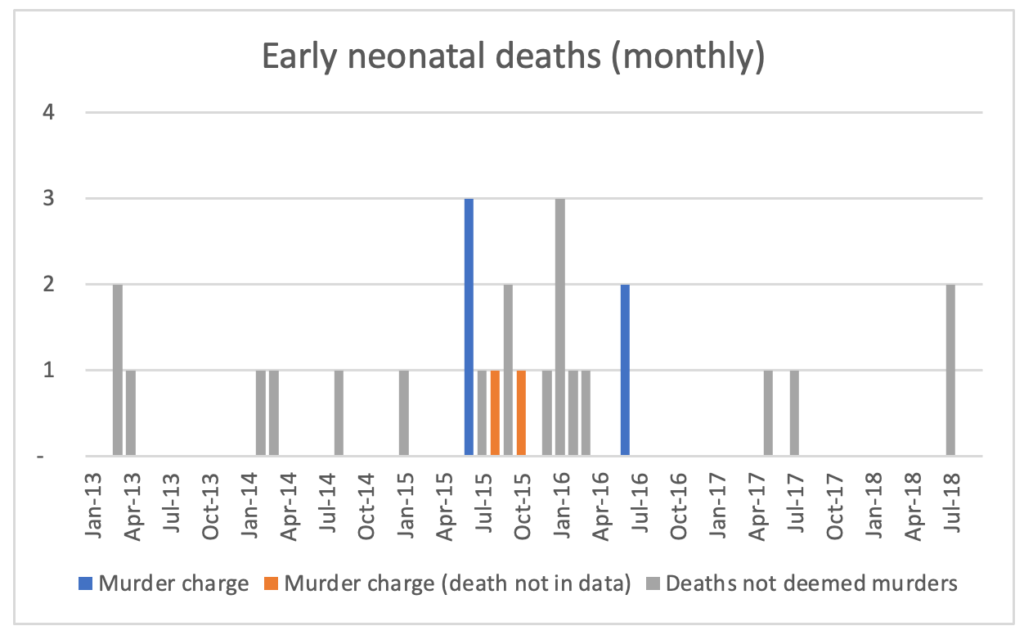
If we remove the 7 alleged murders from the above, we end up with data pertaining to non-suspicious deaths, as below. This series should be Poisson distributed (unless in addition to a serial killer there was something else going on e.g. a staff shortage, poor medical care, or contamination of some sort.)
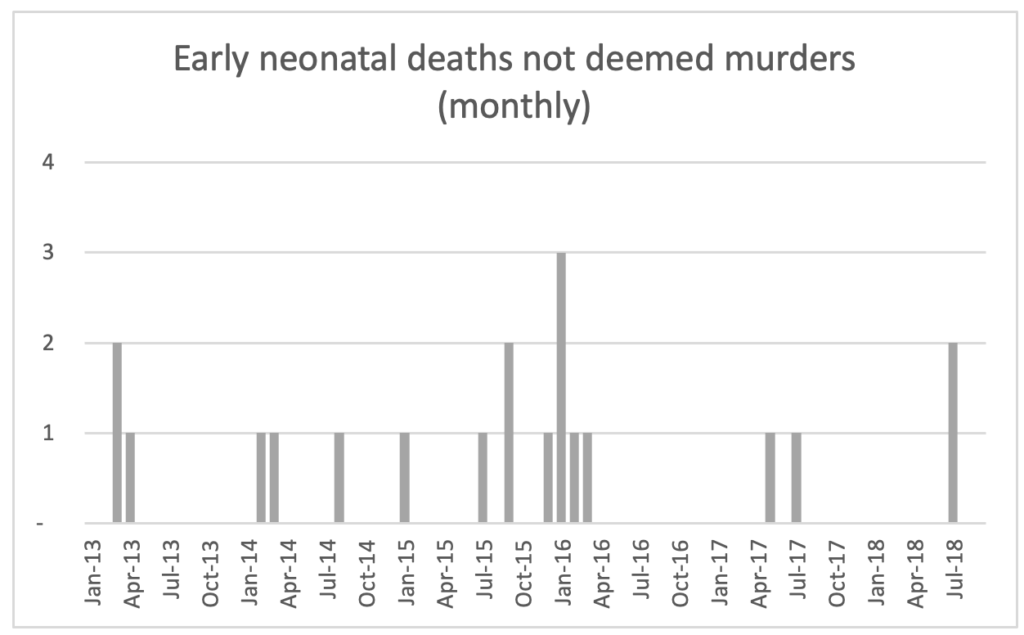
Now, the period we are interested in is the one during which Letby is alleged to have been on her killing spree, from June 2015 to June 2016. There were 9 non-suspicious deaths during this period, from July 2015 to March 2016. We want to know the probability of there being nine deaths during the nine month period in question (July 2015 to March 2016).
To determine this we calculate the expected number per month, which we can calculate based on the average outside of the nine month period in question (the answer is 0.18 per month). To calculate the probability of nine deaths in a nine month period, we first multiply this monthly average by nine to get the expected number of deaths in any nine month period (0.18 times 9 equals 1.65). We then use this average to calculate the probability of there being nine deaths during the nine months from July 2015 to March 2016.
The answer?
0.0048% or 1 in 20,845!
In other words, there is a 1 in 20,845 (0.0048%) probability that the nine deaths occurred by chance. Conversely, there is a 20,844 in 20,845 probability (99.9952%) that the nine did not occur by chance i.e. that in addition to a serial killer there was some other factor at work.
Given that it is extremely unlikely that there were two unrelated factors simultaneously causing the number of deaths in 2015 and 2016 to be elevated (serial killer plus something else) and that the probability of the ‘non-serial killer factor’ is virtually 1, this must surely cast doubt on the prosecution’s assertion that Letby is a murderer (this is neither a legal nor a medical argument but a purely statistical one).
There is another possibility, namely that Letby was responsible for all or many of the nine ‘non suspicious’ deaths but left no trace. However, given that it is clear the prosecution’s case was driven first by roster data (note similarities with Lucia de Berk case) and subsequently by alleging various methods of killing (air embolism, insulin administration, other acts of harm, etc) it would seem that the reason that Letby was not charged with any of them was that she wasn’t on duty (surely if Letby had been on duty, and given the inconsistency in the medical evidence presented by the prosecution for the 22 charges and the circumstantial nature of it, a way would have been found to charge her with them. Perhaps the reason parents did not demand in the press they be investigated is that they were told by the police Letby was not on duty so could not be connected with them). Moreover, if Letby was clever enough to use undetectable methods in relation to some or all of the nine deaths, why also use highly detectable and risky methods such as insulin administration in others? One would also have to question, if Letby was so adept, why she failed on 15 occasions (the attempted murder allegations).
The only way the case makes sense statistically is if Letby is not a murderer.
Sep 26, 2023
In this and other blogs you have raised many disturbing issues. In particular I value your discussion of the expert witnesses and I am disturbed that no statistician was called: neither by the prosecution nor the defence.
I would like to raise one point about this statement.
“In other words, there is a 1 in 20,845 (0.0048%) probability that the nine deaths occurred by chance. Conversely, there is a 20,844 in 20,845 probability (99.9952%) that the nine did not occur by chance i.e. that in addition to a serial killer there was some other factor at work.”
This is not correct. If the calculations are accepted, a better formulation would be “there is a 1 in 20,845 (0.0048%) probability of the nine deaths occurring if chance is the explanation” You need to distinguish between the probability of the evidence given the hypothesis and the probability of the hypothesis given the evidence. If you argue the way you do here, then you could say (correctly) that the probability of four sixes in four rolls of a fair die is one in 1296 and argue therefore (incorrectly) that if you have seen this, the probability that the die is fair is 1 in 1296. However, one cannot reverse conditionals in this way. I call this ‘invalid inversion’ Invalid Inversion | Significance | Oxford Academic (oup.com)
For example, is the Pope a catholic? Very probably. Is a Catholic the Pope. Almost certainly not.
However, the point is that in any case much of the discussion of Lucy Letby’s guilt or innocence involved completely informal, uninformed and irrelevant judgements of statistical matters. Lucy Letby may be guilty for all I know but the process of deciding between her guilt or innocence seems to have been deeply flawed. Show Less
LikeReply2 Likes

Sep 27, 2023
Replying toStephen Senn
Thank you for this post and for your comments.
I confess that I am finding it hard to distinguish between “probability that the nine deaths occurred by chance” and “probability of the nine deaths occurring if chance is the explanation”. They are both very very low, whichever way you look at it. The difference, on the other hand, between the probability of someone being catholic if they are the pope (1) and the probability of someone being the pope if they are catholic (v v v low), is almost as big as it could be.
Am I right in thinking that the maths is correct but that I have described the meaning of the number incorrectly? Even if there is a difference between “the probability that the nine deaths occurred by chance” and “the probability of the nine deaths occurring if chance is the explanation”, which in any case would be minuscule.
I suppose a question would be, how does one calculate “the probability that the nine deaths occurred by chance”?Show Less
LikeReply
Sep 29, 2023
Replying toPeter Elston
The probability of evidence given innocence is not the same as the probability of innocence given the evidence just as the probability of being a Catholic given that you are the Pope is not the same as the probability of being a Pope if you are a Catholic. Similarly, the probability that a randomly chosen woman has breast cancer is low but the probability that a randomly chosen breast cancer victim is a woman is high.
To confuse the two is sometimes called the ‘error of the transposed conditional’. I prefer to call it invalid inversion. If ‘|’ stands for ‘given’ and p( ) for probability of, the general rule is P(A|B)=P(A&B}/P(B) but P(B|A)=P(A&B}/P(A). These two are not the same unless P(B)=P(A). However, in my two examples the number of Popes is far fewer than the number of Catholics and the number of breast cancer victims is far fewer than the number of women, hence the dramatic differences in probability.
Calculating what you want is often very difficult and requires lots of assumptions and would take a whole post to address. All the more reason to say that the court needed advice from an expert legal statistician.Show Less
LikeReply

Sep 30, 2023
Replying toStephen Senn
I get all that and have written about it. I just do not think that the probability of the deaths occurring by chance and the probability of deaths occurring if chance is the explanation are the equivalent of P(A|B) and P(B|A). The first two are both very low (they both relate to the probability of deaths occurring). The latter two as you say can be very different (one relates to prob of pope being a catholic and the other the prob of a catholic being a pope).
LikeReply

Sep 30, 2023
Replying toPeter Elston
Perhaps you could write in probability notation the two probabilities, that of deaths occurring by chance and that of deaths occurring if chance is the explanation.
LikeReply
Sep 05, 2023
Has there been an explanation put forward as to why there were no baby deaths in the hospital records for August 2015 and October 2015 (corresponding to two of the murder convictions)?
LikeReplyView 4 replies
Aug 28, 2023
Appalling. But were LL’s defence team not allowed to reference the report? Would that not be up to the judge to decide, not the police?
LikeReply
Aug 28, 2023
“And neonatal deaths are going to be independent of each other (the condition of a particular baby is unrelated to the condition of another).”
Is that a fair accurate assumption? Several of the infants/neonates in the LL case were twins or triplets, who might well share health issues reducing (or increasing) survival chances.
LikeReply
Aug 22, 2023
Question: It’s reported in the Observer (19/8/2023) that in June 2015 three newborn babies had died on the neonatal unit in the space of just 14 days. (And a 4th baby almost died after deteriorating suddenly during this same period.)
If this is true (and I am assuming that these are three that Lucy Letby was charged with) then how could it affect the statistical analysis? The monthly unit of analysis is simply an artefact of how the data is recorded. But what would happen to the analysis here if a 14-day period was adopted? Is the data available for this?
LikeReply
Aug 20, 2023
This is absolutely fascinating to read. I wish someone on her defence team had put this forward to the jury!
LikeReply7 Likes
Aug 23, 2023
Replying tobex_25
Given the gravity of her sentence I think the defence team should have done so much more. I hope she can appeal and this is presented as part of the appeal.
LikeReply
N
G3 Likes
Aug 20, 2023
This is so important. Difficult for policemen to understand, I fear. Also difficult for jurors, difficult for journalists. The report published by the Royal Statistical Society was apparently just not good enough. https://rss.org.uk/news-publication/news-publications/2022/section-group-reports/rss-publishes-report-on-dealing-with-uncertainty-i/ A senior police inspector from the appropriate region of England told me personally, when we presented our report well before publication (in order to get feedback) to numerous stakeholders at the Newton Institute in Cambridge “we are not using statistics, it only makes people confused”. The report took two years to write, and was sent in advance of the trial to *all* trial actors.
LikeReply18 Likes
Aug 21, 2023
Replying toRichard Gill
That doesn’t surprise me in cases of confirmation bias.
LikeReply
© Chimp Investor Ltd






Interesting and you may be correct in suggesting that even once the cases attributed to Lucy Letby are excluded the data does imply the likely existence of some other causal factor, though I agree with Stephen Senn’s point that it is invalid to say:
“…there is a 20,844 in 20,845 probability (99.9952%) that the nine did not occur by chance…”
Unlikely events do occur. Some people do win the lottery. Some neonatal nurses are on shift when a relatively large number of deaths occur.
David Liv’s point that:
“Several of the infants/neonates in the LL case were twins or triplets, who might well share health issues reducing (or increasing) survival chances.”
is also valid and complicates any statistical analysis of the data – I’ve written about this at https://timjoslin.org/index.php/2024/09/04/lucy-letby-damn-lies-and-statistics/ .
My question is, is it valid to “calculate the expected number per month… based on the average outside of the nine month period in question (the answer is 0.18 per month)”?
If the null hypothesis is that the deaths are randomly distributed, then surely all deaths should be included to determine the expected number per month, i.e. we need to calculate the average for the entire period, including July 2015 to March 2016.
Not including July 2015 to March 2016 in determining the expected death rate assumes the deaths over that period did not occur by chance, but what we’re trying to establish is the probability that they did occur by chance.
Notwithstanding this quibble, this sort of analysis is very useful.