

Lucy Letby: A Further Look at the Infant Mortality Statistics
Comparing hospital (FOI), MBRRRACE, and ONS data raises more questions
Update on reporting restrictions: I have not sought legal advice about what the reimposition of reporting restrictions means for what I can write in relation to Lucy’s case but I have spoken to someone who knows about these things. The test is whether a published report poses a “substantial risk of serious prejudice.” The trial to which the reporting restrictions pertain is a year or so away (it hasn’t even started!) This blog post is not about Baby K (the case being retried) but is an objective appraisal of the publicly available, official data from key sources.
Analysis update: I have been made aware that the ONS does “not hold data on NHS trusts. ONS mortality data are published in line with the National Statistics Postcode Lookup which is based on the area of usual residence of the deceased” and also that the families of five of the seventeen babies in Lucy’s case were from Wales (https://www.walesonline.co.uk/news/wales-news/five-babies-killer-nurse-lucy-27653002# ). Even if all five babies were babies who died, this would still not account for the six ‘negative deaths’ in 2015 and 2016 discussed below, particularly given the number of ‘positive deaths’ in 2017, 2018, 2019, and 2020. Rather than amending this post, I have published a new post addressing the specific issue, Lucy Letby: The North Wales Conundrum.
Intro/background
In June I wrote a blog post titled Do Statistics Prove Accused Nurse Lucy Letby Innocent? It was a detailed assessment of data in the public domain at that time, notably infant mortality data from The Countess of Chester (CoCH) that was obtained through an FOI (freedom of information) request. It also highlighted the many and relevant parts of the RCPCH service review about issues with UVC insertion, understaffing, high activity, poor reporting, etc, as well as other irregularities.
Following my June blog post, I became more aware of infant mortality statistics provided by MBRRACE -UK (Mothers and Babies: Reducing Risk through Audits and Confidential Enquiries across the UK) and the ONS (Office of National Statistics) that collect data from trusts across the country (then publish trust level data as well as numerous aggregates).
It has taken me a while but I have finally got round to doing a detailed side-by-side appraisal of the three datasets. In short, there are discrepancies between each of them which raise important questions about what was actually going on at CoCH.
This blog post is quite technical but I hope can be followed by a broad audience. It should also in time provide more serious statisticians than myself with a decent appraisal of the mortality data that they could use to do a truly formal analysis. And it I hope will be useful as a reference for anyone wishing to see infant mortality statistics that relate to Lucy’s case.
The datasets
In the research that I conducted for this blog post I used six datasets, one from CoCH itself (the dataset obtained via the FOI request), three from MBRRACE, and two from the ONS. Four of the datasets pertained to CoCH itself, either directly (the FOI dataset and two of the MBRRACE datasets, crude and stabilised/adjusted, pertain directly to CoCH) or indirectly (one of the ONS dataset pertains to Chester and Cheshire West, c. 80% of which is CoCH). The other two datasets (one each from MBRRACE and the ONS) pertain to England. These latter two are useful when comparing mortality rates (deaths per 1,000 births) between England and CoCH/Chester and Cheshire West. You can see my spreadsheet in which I have collected and processed data here (Infant mortality data.xlsx) and a folder containing all the downloaded data here (Infant mortality data).
The URLs of the three datasets (or where datasets can be found) are below.
CoCH (FOI): https://www.whatdotheyknow.com/request/neonatal_deaths_and_fois#incoming-1255373
MBRRACE-UK: https://timms.le.ac.uk/mbrrace-uk-perinatal-mortality/
User guides can be found as below.
MBRRACE: https://timms.le.ac.uk/mbrrace-uk-perinatal-mortality/surveillance/technical-manual.html
The hospital (FOI) information is the actual number of deaths, and can be converted into a mortality rate (deaths per 1,000 births) using the number of births (live and total) from MBRRACE. This allows data from the three sources to be compared with each other, as well as to be compared with rates across England as a whole provided by MBRRACE and the ONS.
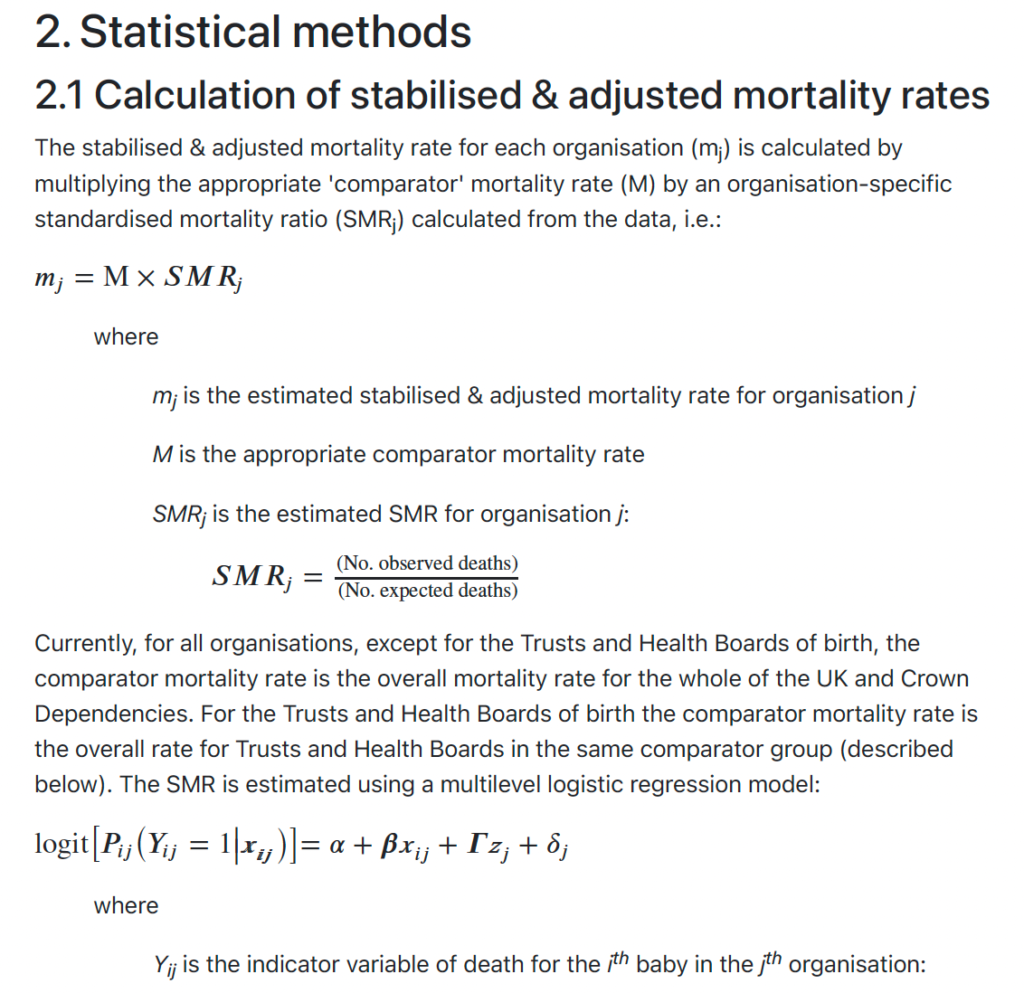
MBRRACE provides mortality data for each hospital trust (including CoCH) as well as by region (England, England and Wales, UK etc). Furthermore, it provides data on a ‘crude’ basis as well as on a ‘stabilised and adjusted’ basis. ‘Crude’ simply means the actual number of deaths in various categories during the period (year) in question. The ‘Stabilised and adjusted’ mortality rate “takes into account the effects of chance variation and also allows for key factors known to increase the risk of perinatal mortality”. It is described in more detail below (taken from the MBRRACE-UK Perinatal Mortality Surveillance Technical Manual Version 1.2)
For service delivery organisations, some organisations have a higher proportion than others of women at high risk of experiencing a stillbirth or neonatal death: for example, they provide a national or regional specialist service or serve areas of high socioeconomic deprivation. Thus the case-mix of the service users can influence mortality rates even when high quality maternity and neonatal care is provided. The mortality rates for service delivery organisations are, therefore, also adjusted to account for key factors which are known to increase the risk of perinatal mortality: i.e. stabilised & adjusted mortality rates. The extent of the adjustment is limited to those factors that are collected for all births across the whole of the UK: mother’s age; socio-economic deprivation based on the mother’s residence; baby’s ethnicity; baby’s sex; whether they are from a multiple birth; and gestational age at birth (neonatal deaths only). Therefore, some factors that might be associated with poor perinatal outcomes could not be taken into account in the adjustment because they are not universally collected on all births; for example, maternal smoking and body mass index (BMI). As for stabilised rates, the stabilised & adjusted mortality rate will also tend to be closer to the average mortality rate than will the crude mortality rate, especially for organisations with a small number of births.
The ONS provides infant mortality data for local regions (in Lucy’s case, the local region that is relevant is ‘Chester and Cheshire West’, c. 80% of which is accounted for by the Countess) as well as for England, UK, etc.
In terms of categories, the ONS breaks down its data into ‘stillbirths’, ‘neonatal’ and ‘perinatal’, allowing one to derive ‘early neonatal’, ‘late neonatal’, and ‘extended perinatal’ (see below definitions).
Note that the datasets do not overlap neatly, whether in terms of period covered or categories of death presented. The FOI data spans the period from January 2014 to October 2018 but has the most exhaustive number of mortality categories. MBRRACE data for CoCH covers 2014 to 2021 but only for two categories, stillbirths and neonatal deaths (and ‘crude’ data in 2016 and 2018 is not provided since numbers were low which increased possibility of identification of individuals). MBRRACE data for England and ONS data for England and Chester/Cheshire West have similar issues.
Nevertheless, where there is overlap, comparisons can be made that are useful. Despite differences with respect to period covered, all charts presenting annual data cover 2013 to 2021 inclusive so that they all correspond with each other, making visual comparison easier (I have added “n/a”s above the x-axis (years) where there is no data). Charts that present the monthly (FOI) data are based on the entire period from Jan 2013 to Oct 2018 (other than one which presents winter deaths where I have estimated deaths in December 2012 using the average of all December data, other than December 2015 which was during the Lucy’s alleged killing spree, in order to be able to use the Jan to Mar 2013 data and thus to increase the sample size and make the statistical analysis more robust).
Definitions relating to category of death (from MBBRACE)
Late fetal [foetal] loss – A baby delivered between 22 and 23 completed weeks’ gestational age showing no signs of life, irrespective of when the death occurred.
Stillbirth – A baby delivered at or after 24 completed weeks’ gestational age showing no signs of life, irrespective of when the death occurred.
Early neonatal death – A liveborn baby (born at 20 completed weeks’ gestational age or later, or with a birthweight of 400g or more where an accurate estimate of gestation is not available) who died before 7 completed days after birth.
Late neonatal death – A liveborn baby (born at 20 completed weeks’ gestational age or later, or with a birthweight of 400g or more where an accurate estimate of gestation is not available) who died after 7 completed days but before 28 completed days after birth.
Postneonatal death – A death of a live born baby (born at 20+0 weeks gestation of pregnancy or later or 400g where an accurate estimate of gestation is not available) occurring after 29 or more completed days after birth.
Neonatal death – An early or late neonatal death (see above)
Perinatal death – A stillbirth or early neonatal death (see above)
Extended perinatal death – A stillbirth or neonatal death (see above)
Infant death – A neonatal or postneonatal death (see above)
The hospital data obtained via the FOI request
The data from the hospital was monthly, spanned the period from January 2013 to October 2018 inclusive, and presented the number of deaths in five categories (late fetal loss, stillbirths, early neonatal deaths, late neonatal deaths, and post neonatal deaths). See chart below.

In my June post I noted that there were no deaths recorded in the FOI data in August or October 2015 when the deaths of Babies E and I occurred, respectively.
According to the Court records, Baby E died on 4 August so one supposition is that this was the July early neonatal death in the FOI data (or possibly one of the three July stillbirths). However, I would argue this is unlikely. First, a neonatal death is not a stillbirth. The two categories are clearly defined and mutually exclusive. Second, the hospital might have recorded the death a few days late (which would itself be poor) but a few days early? 4 August 2015 was a Tuesday. Could it really have been recorded as having happened in July i.e. on or before the previous Friday? I somehow doubt it.
Baby I died on 22 October. Given that this is 9 days from the end of the month it is unlikely to be the late neonatal death recorded in November and almost certainly neither of the two early neonatal deaths in September. And anyway, Baby I died aged 76 days so would have been recorded as a postneonatal death. 76 days is well after the threshold for a postneonatal death (more than 28 days) so there is little chance of it being wrongly recorded as a late neonatal death. Also, there were no post neonatal deaths recorded in either September or November.
So, I think it can be assumed that the hospital did not record the deaths of the two babies, supported by the RCPCH service review that found:
“Two of the cluster of deaths were not reported; the current policy indicates that not all deaths need to be submitted as DATIX, if they are “expected deaths”, and in 2015-6 only 10 of the 13 deaths were reported as incidents on the neonatal incidents summary. The definition of ‘expected’ was not available but presumed to be that used in safeguarding/child death panels and it was not clear who is responsible for DATIX entry. Other areas in the hospital report well but the neonatal unit have for some time apparently been less systematic in reporting.” (RCPCH clause 4.4.5)
Adding the two deaths to the FOI data means that there were 17 infant deaths during the 13 month period from June 2015 to June 2016, the period during which Lucy was alleged to have murdered 7 babies. In other words, there were 10 deaths that she wasn’t charged for (see charts below). Now, the monthly average infant deaths at CoCH outside of the 13 month period was 0.32 (sample size 57 months) which equates to a 13 month average of 4.1. The probability of 10 (or more) deaths occurring during a 13 month period if chance (natural variation) is the explanation is just 0.34% or 1 in 290.


Furthermore, 6 of these 10 deaths that Lucy was not charged with occurred in the period from December 2015 to March 2016 (winter) which is a particularly high number (see chart below). The average number of deaths for these particular four months outside of the four months in question was 1.4 (in order to increase the sample size number of periods from four to five, I have estimated the number of infant deaths in Dec 2012 using the average for December in each of 2013, 2014, 2016, and 2017) and I have calculated that the probability of six (or more) deaths occurring if chance (natural variation) is the explanation is just 0.06% or 1 in 1,607. If one uses only the winters of ’12/’13, ’13/’14 and ’14/’15 to calculate the average to take account of the possible effect of the downgrade on the unit in July 2016, the probability rises to 1.01% or 1 in 99 but this is still very low.
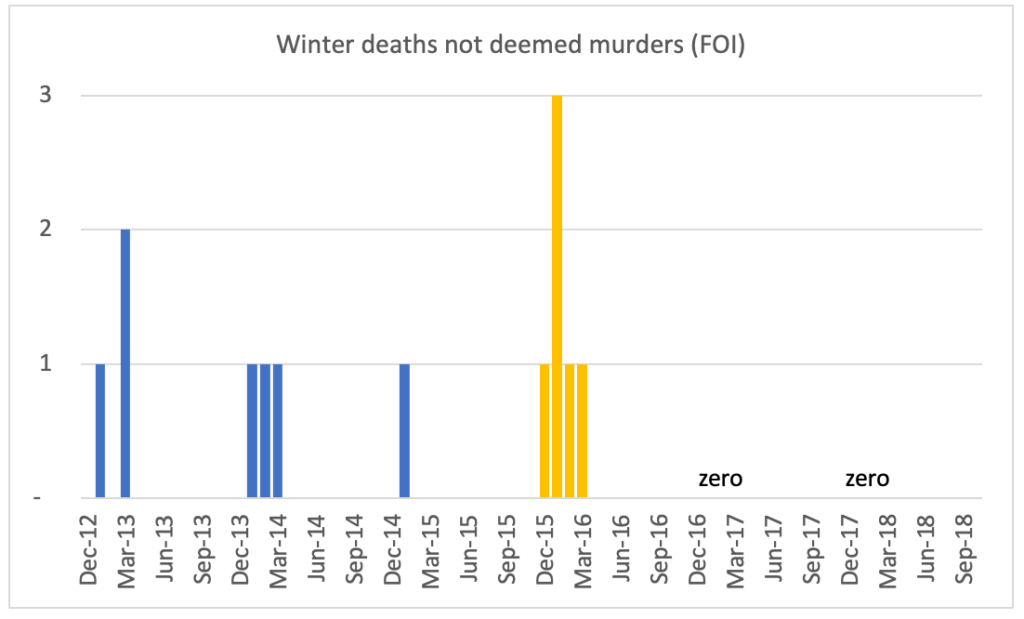
In summary, although the probabilities are a little higher than in my June post they are still very low; my calculations are now based on infant deaths not just early neonatal deaths and I am also now not including the death of Child K as having occurred at CoCH, even though it seems the baby should have been transferred sooner and thus the death may have been inevitable and thus in some respects could be deemed to have occurred at CoCH. This all means that since the prosecution did not associate Lucy with any of the other ten deaths, it is arguing, effectively, that along with a baby murderer, there was some other factor causing the spike in deaths. This is an extraordinary coincidence, though of course we know from true crime shows that police detectives never believe in coincidences. Er….
There is also some specific and unknown factor that caused the spike in deaths in the winter of 2015/6. There must be a good reason why Lucy was not charged with any of them. And why there were many more than in other winters. One answer would be that they related to seasonal flu, exacerbated perhaps by the issues highlighted in the RCPCH report. The former might explain why there were no unusual rashes that Evans and Co. could get their teeth into, the latter why there were more than in other winters. Just a hypothesis.
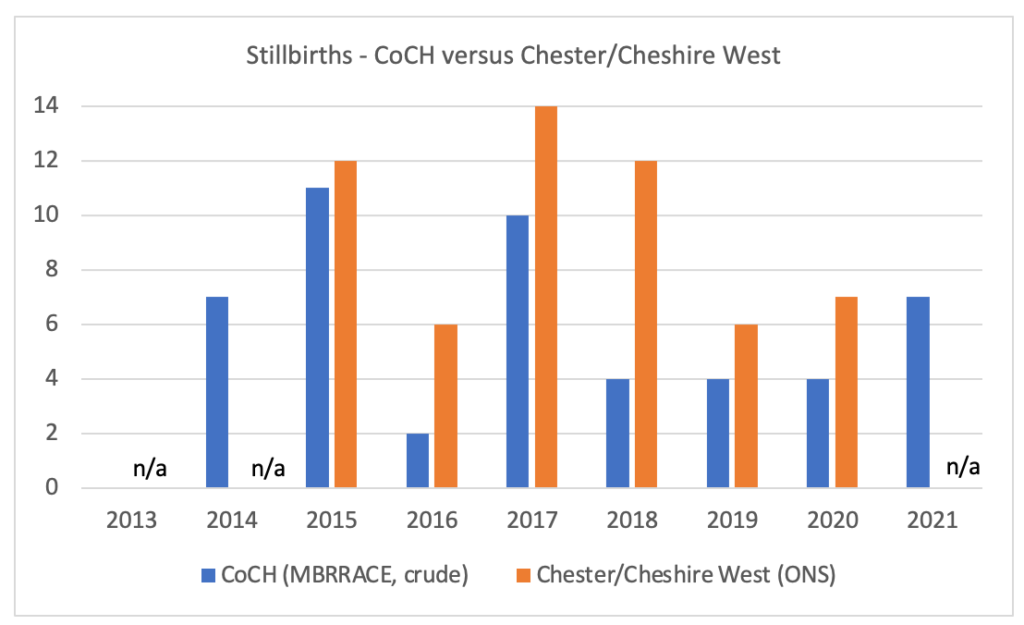
There is another discrepancy in the CoCH (FOI) data, one I had not spotted when I wrote my June post. There were a very small number of stillbirths recorded (just two) in 2016 (this is not a typo in the annual number since the aggregate of the monthly data is also two) compared with 8, 9, 12, 11, and 6 in 2013, 2014, 2015, 2017 and 2018 respectively (see chart below). Since the 6 in 2018 were the ten months up to and including October, this can be annualised to 7, giving a mean outside of 2016 of 9.4.
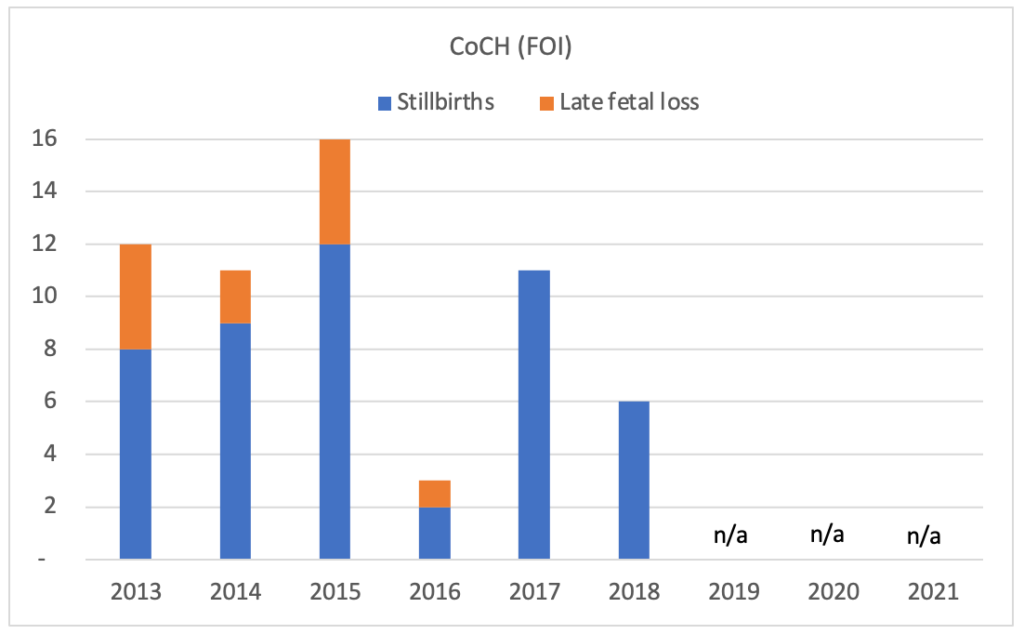
The probability of there being 2 (or fewer) stillbirths if chance was the explanation is 0.44% or 1 in 229. In other words, there was some new factor that was causing the unusually low number of stillbirths in 2016. It has been suggested that there was recategorisation issue, supported by the Telegraph article NHS logging baby deaths as stillbirths ‘to avoid scrutiny’. However, if this suggestion is correct, the number of stillbirths would have been higher not lower. Some hospitals might have thought they could get away with recategorising live births as stillbirths, per the article, but surely not the other way round. And anyway, why would hospitals want more scrutiny?
Enter MBRRACE
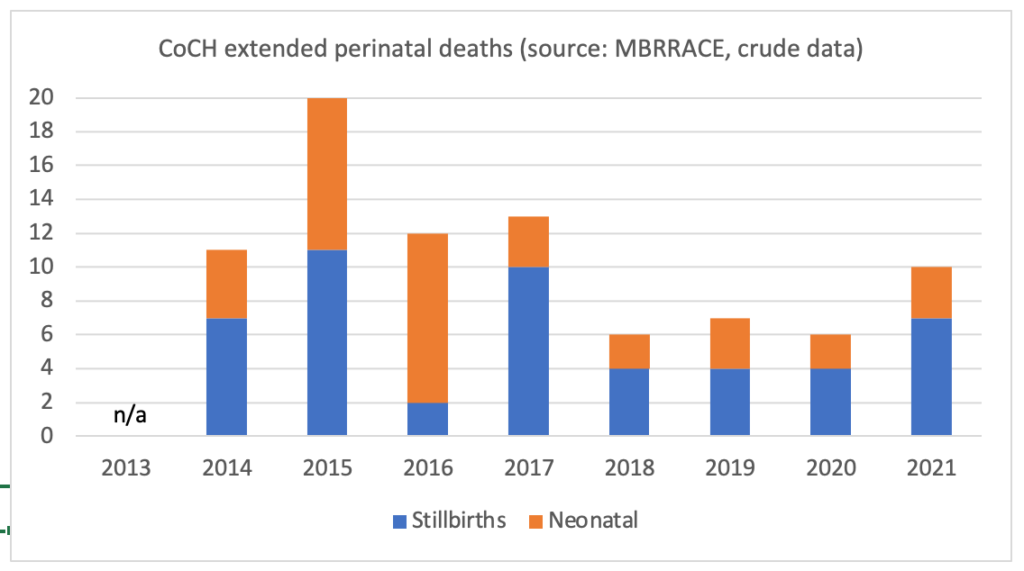
For individual trusts, MBRRACE publishes data on rates (per 1,000 births) of stillbirths, neonatal deaths, and extended perinatal deaths. Given that it also publishes the total number births, one can calculate live births by subtracting stillbirths from total births. One can then use the five data items to calculate the number of stillbirths, neonatal deaths, and extended perinatal deaths (number of deaths equals number of births times rate of deaths per 1,000 births divided by 1,000).
Where the number of stillbirths or neonatal deaths is low, rates are not published given the greater possibility of identification. If only one (of stillbirths or neonatal deaths) is low, the other is not published given that it could be used, along with extended perinatal deaths data, to calculate the low item and thus potentially identify individuals.
MBRRACE did not publish stillbirth or neonatal death data for CoCH in 2016 or 2018. However, we have the FOI data for those years and, indeed, one of the item (stillbirths or neonatal deaths) in each year was low (there were just 2 stillbirths in 2016, while in 2018, there were just 2 neonatal deaths). Data was also suppressed in 2020 and since the FOI data did not cover that period, the number of stillbirths and neonatal deaths that year have been estimated by applying a general ratio between the two (6 extended perinatal deaths => 4 stillbirths and 2 neonatal deaths). This does not seem unreasonable, as you will see.
The charts below show the crude/actual number of stillbirths and neonatal deaths data for CoCH from both the FOI request and MBRRACE.

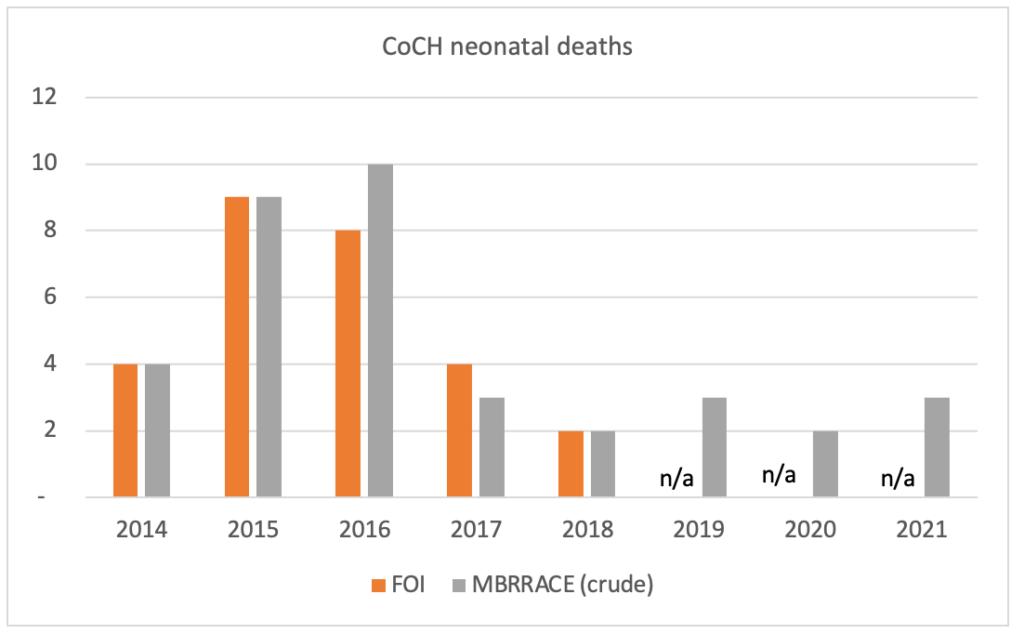
In sum, the crude MBRRACE data for CoCH (for stillbirths and neonatal deaths) appear to correspond with the hospital (FOI) data, if at times only roughly.
As for the MBRRACE stabilised and adjusted data in relation to CoCH, what can be learned from them? As mentioned above, the crude data are stabilised and adjusted to “take into account the effects of chance variation and also allow for key factors known to increase the risk of perinatal mortality”. MBRRACE goes on to say that “the stabilised & adjusted mortality rate will also tend to be closer to the average mortality rate than will the crude mortality rate, especially for organisations with a small number of births”.
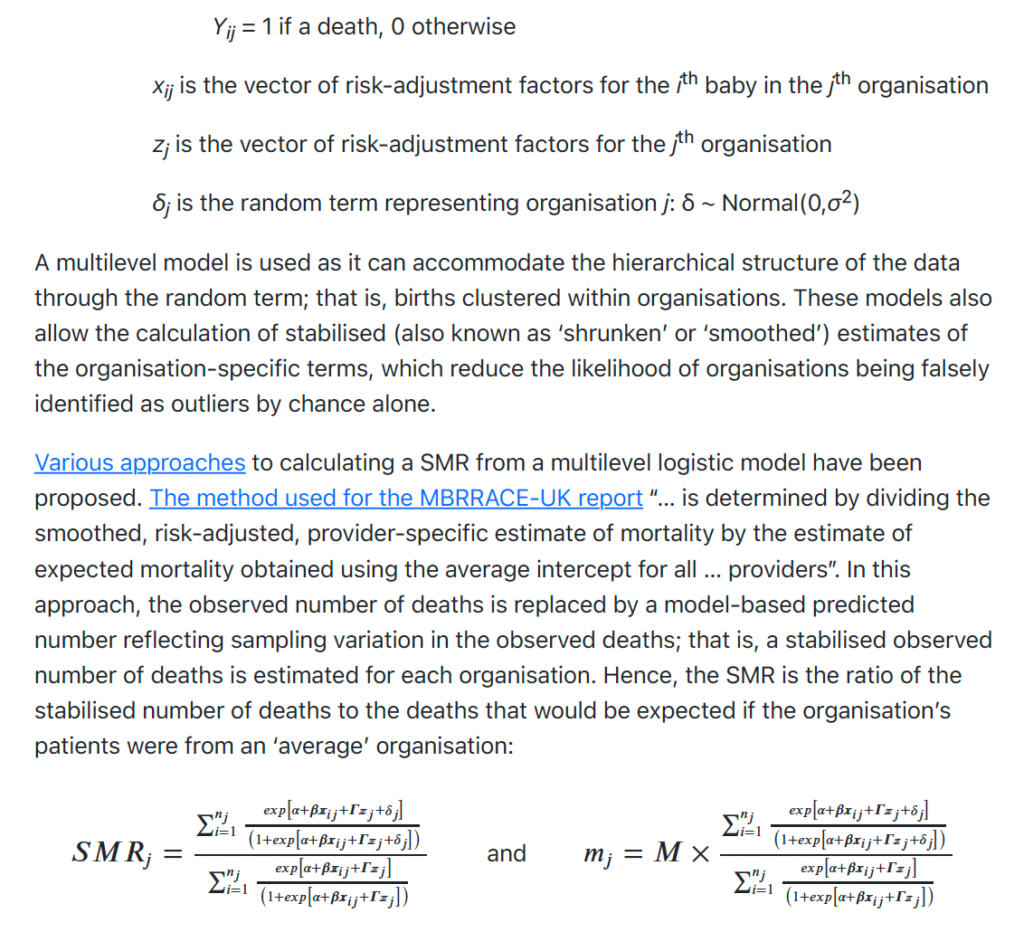
MBRRACE’s methodology with respect to stabilised and adjusted data can be found in Appendix 1 below. The calculations are complex but, in short, the aim is to smooth/dampen the crude data in order to produce more meaningful data series.
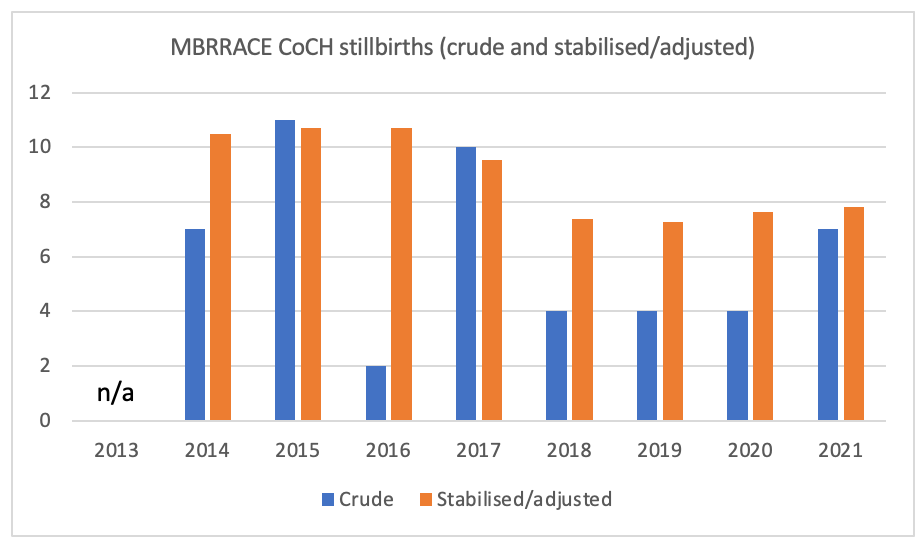
The two charts below show, respectively, the crude and stabilised/adjusted data for stillbirths and neonatal deaths. The effects of the stabilisation and adjustment can be clearly seen.
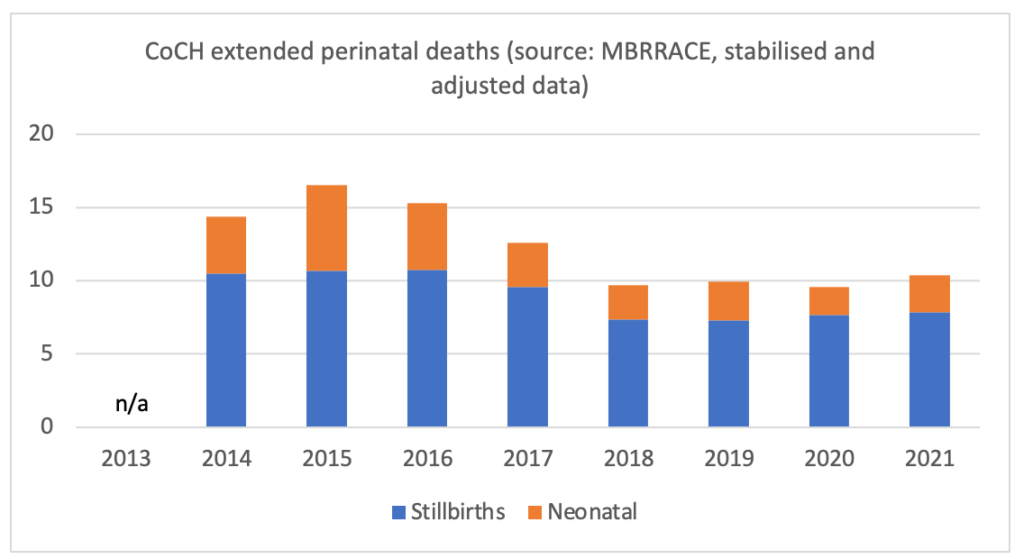
The three charts below present the data in a slightly different way. They show the crude and stabilised/adjusted data for stillbirths and neonatal deaths, and the size of the adjustment (the stabilised/adjusted data minus the crude data). Although MBRRACE did not publish stillbirth and neonatal death data in 2016 and 2018 because of the “small number of deaths”, I have substituted FOI data which shows a low number in 2016 (just two stillbirths) and a low number in 2018 (just two neonatal deaths).
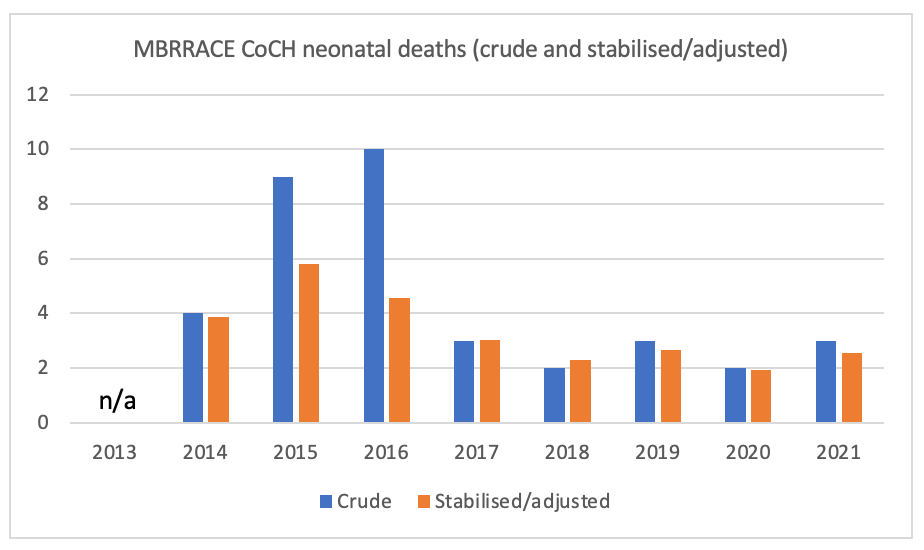

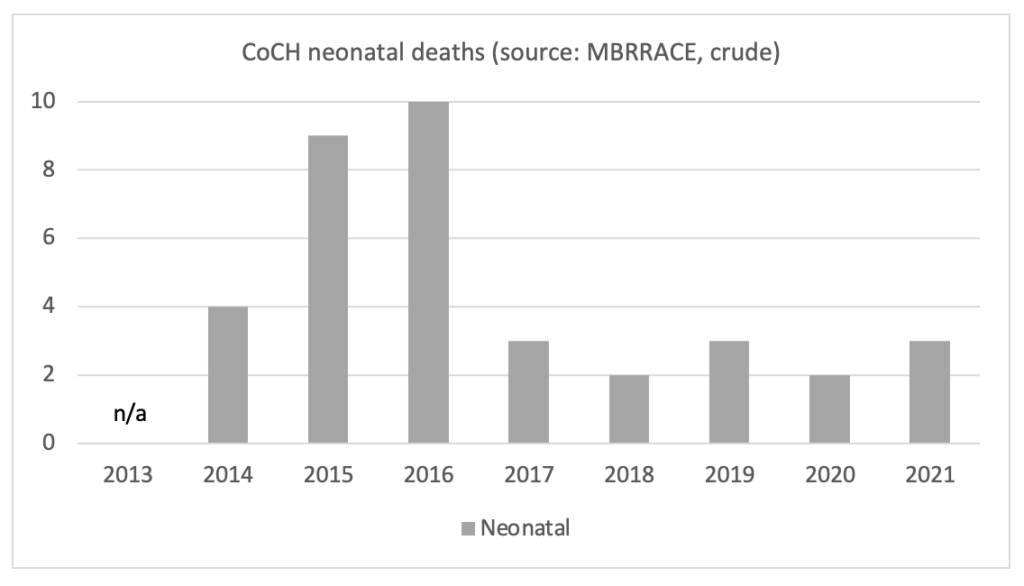
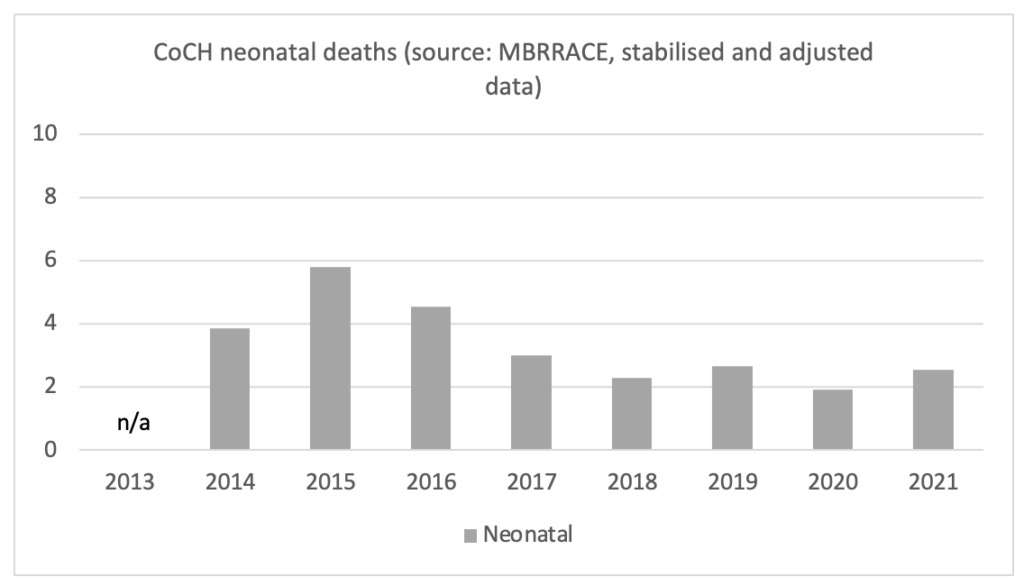
It is hard to know how to interpret the three charts above, particularly the third one. Stillbirths appear routinely to be stabilised/adjusted upwards, while neonatal deaths were stabilised/adjusted downwards substantially in 2015 and 2016, the years of Lucy’s alleged killings. The charts below show neonatal deaths only, before and after stabilisation/adjustment. After stabilisation/adjustment, there is still clearly a high number of neonatal deaths in 2015. However, 2016 is essentially indistinguishable from 2014, while the low numbers from 2017 onwards are almost certainly related to the unit being downgraded in July 2016.
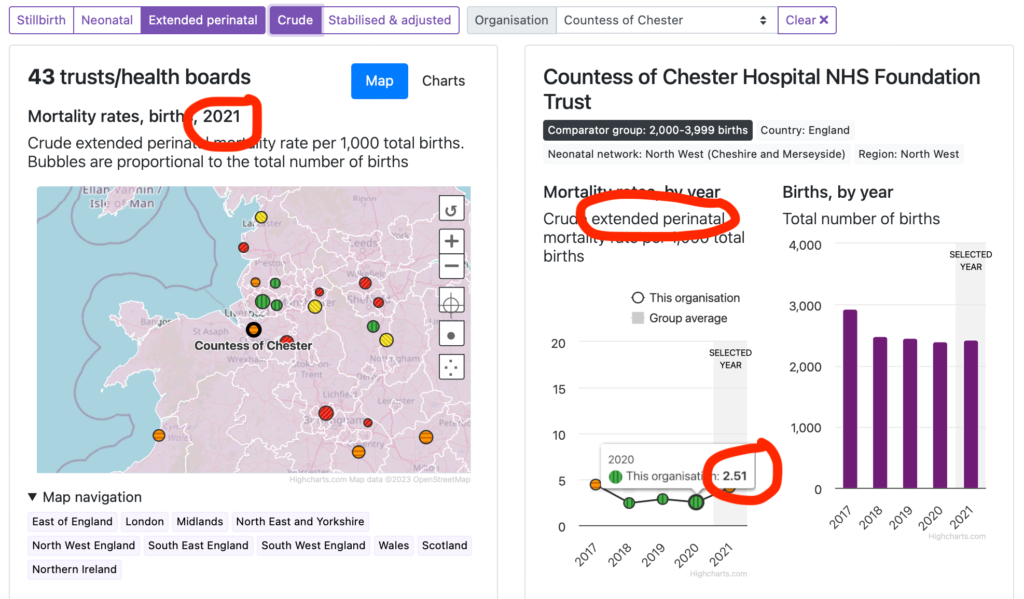
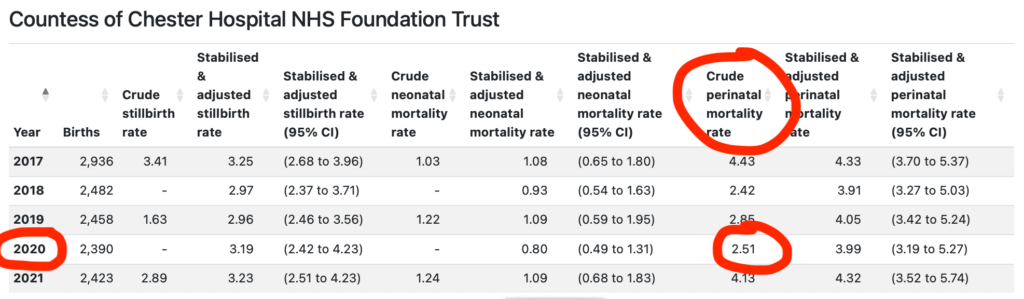
There is one more discrepancy in the MBRRACE data for CoCH. The below two screenshots are of two excerpts from the MBRRACE data. In the first, 2.51 deaths per 1,000 births pertains to extended perinatal deaths. In the second, 2.51 pertains to perinatal deaths. This is not coincidence; the same goes for other years. I have asked the ONS (rather than MBRRACE) about this – it may be less defensive given ONS uses MBRRACE data and I’m sure would want to resolve the matter.
ONS data for Chester/Cheshire West
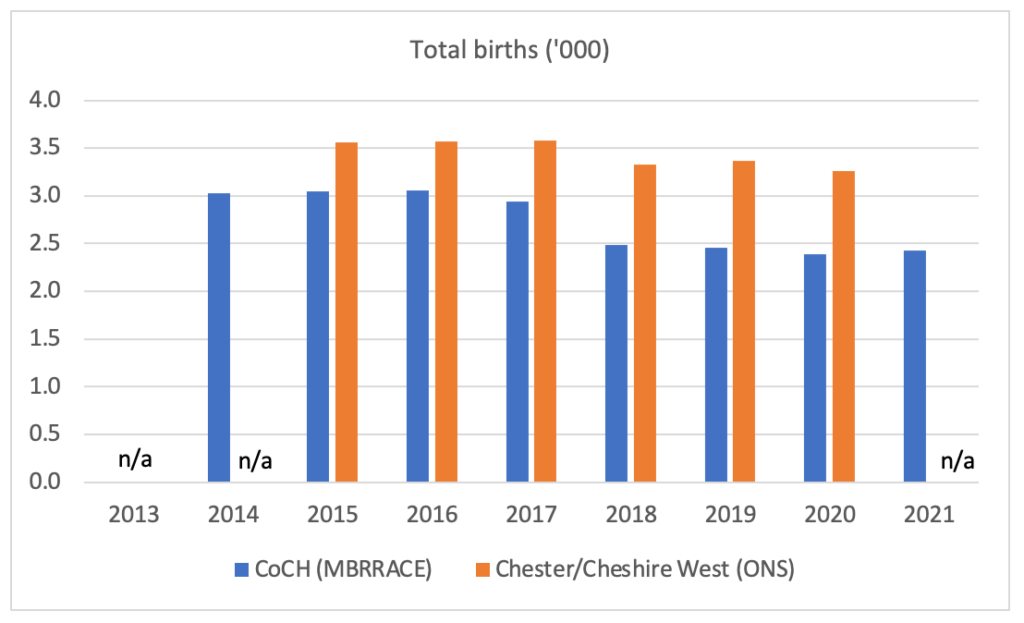
The ONS publishes data not at trust level but on a local area basis. The local area in which CoCH sits is the unitary authority Cheshire West and Chester. The chart below shows total births data for both CoCH (from MBRRACE) and Chester/Cheshire West (from ONS). There is clear correspondence. Births at both CoCH and within Chester/Cheshire West fall from 2016 to 2018, following the downgrade of CoCH’s neonatal unit from Level 2 HDU to Level 1 SCBU. They do not fall as much in Chester/Cheshire West, suggesting that some but not all of the more serious cases were transferred to other units in the area.
Despite the correspondence in total births data, there are some apparent discrepancies in the deaths data. The two charts below show data for CoCH and Chester/Cheshire West for respectively, stillbirths and neonatal deaths. One would expect, given that CoCH is within Chester/Cheshire West, that numbers would be higher for the latter than for the former. This is indeed the case for stillbirths but not for neonatal deaths.

The chart below subtracts CoCH numbers from Chester/Cheshire West to get the implied numbers of stillbirths and neonatal deaths in Chester/Cheshire West outside of CoCH.
An obvious discrepancy is that in 2015 and 2016 there were a negative number of neonatal deaths in Chester/Cheshire West outside of CoCH (if it not obvious, a negative death is absurd), the two years in which Lucy was on her alleged killing spree. This is a disturbing discrepancy that Lucy’s team should certainly investigate.

Introducing national data from MBRRACE and the ONS
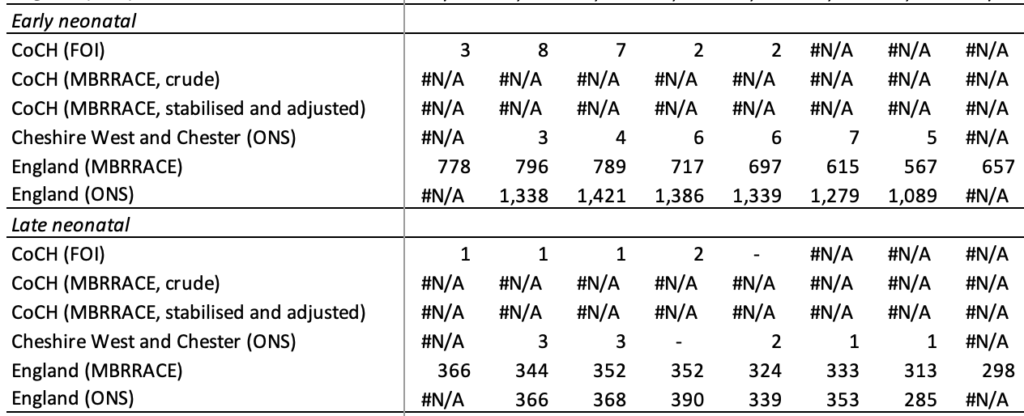
The fifth and sixth datasets that I looked at relate to national data (for England) from MBRRACE and the ONS. While not relating directly to CoCH, there is a clear discrepancy in early neonatal deaths between MBRRACE and the ONS. Late neonatal deaths on the other hand correspond quite closely (see chart below).
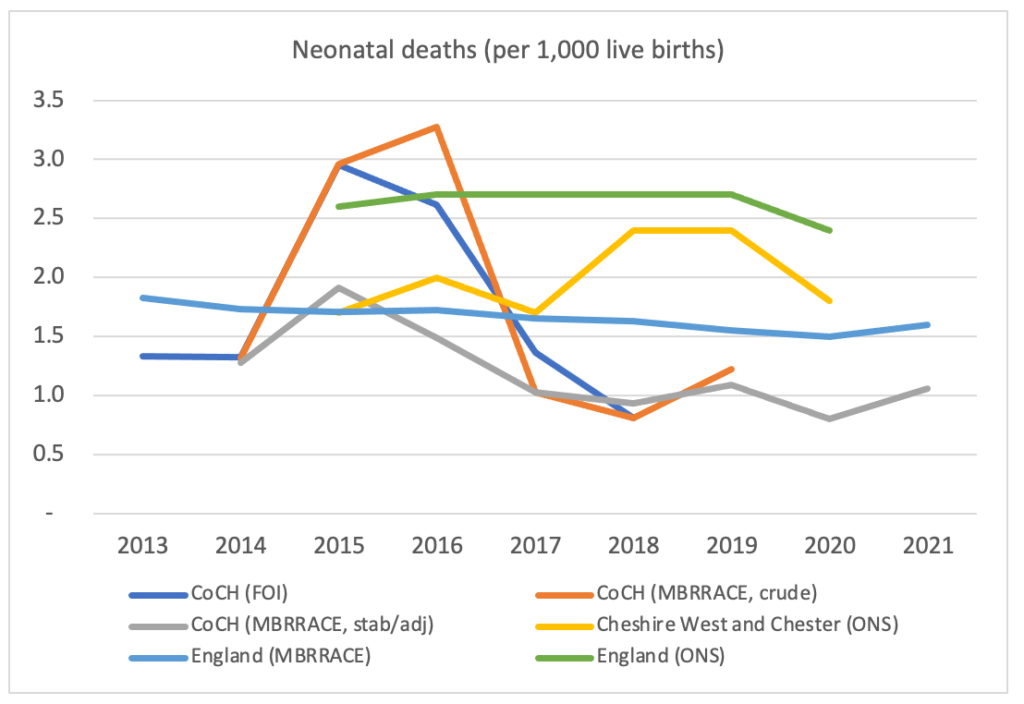
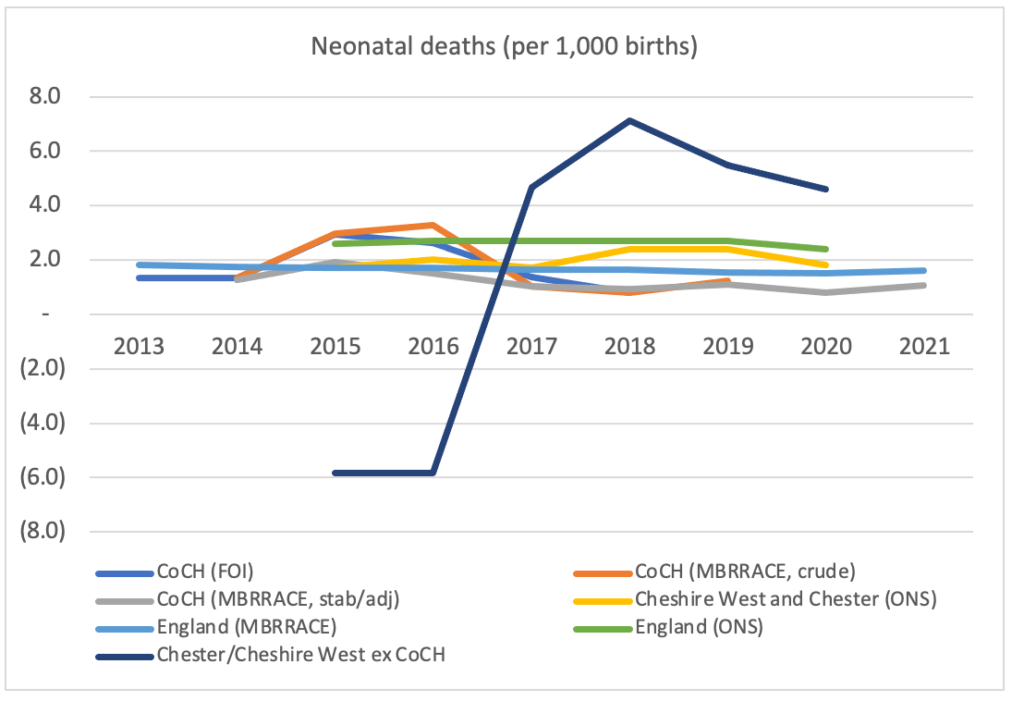
Finally, one can put rates of neonatal deaths (per 1,000 live births) from all six datasets in one chart, as below. The difference in the rate for England between MBRRACE and the ONS is noticeable, as is the increase in the rate in Chester/Cheshire West in 2018 and 2019. Indeed, in relation to the latter, one can also derive a rate for Chester/Cheshire West excl CoCH which is included in the second chart below.
Conclusion
There are numerous discrepancies in the infant mortality statistics from the three data providers that should be investigated. I have contacted the ONS about some of them and will post its response when I receive it.
Of course, this blog post has looked only at discrepancies in the infant mortality statistics. There are certainly discrepancies elsewhere, notably with respect to the roster data table created by Cheshire Constabulary, shown to the jury, and referred to by Judge Goss in his summing up. This should be the subject of another blog post, though I would make the below points here.
- If the ten deaths (in the FOI data) during the period in question (June 2015 to June 2016) which which Lucy was not charged were included, the uninterrupted line of X’s would disappear.
- If all other collapses during the period (of which there must have been many) with which Lucy was not charged were included, then more gaps in the X’s would appear.
- Adjustment should be made for Lucy being single and saving up for a house, and thus doing more shifts.
- Adjustment should be made for Lucy being a Band 5 (more senior) nurse, and thus being assigned more serious cases as well as being more broadly responsible.
- Adjustment should be made for Lucy having an additional intensive care qualification, and thus being assigned even more serious cases.
- It is not clear that an ‘X’ means an event actually happened during one of Lucy’s shifts or near/adjacent to one of her shifts.
- Adjustment should be made for the fact that Lucy was was a good nurse, always willing to do extra shifts when asked.
- Adjustment should be made for the fact that Lucy was a good nurse and therefore was more attentive. If so, she would have been more likely to be present when events occurred.
- Adjustment should be made for the fact that Lucy was was a good nurse, perhaps more willing to do night shifts (where incident rates may have been higher and staffing lower) that others did not want to do
- Adjustment should be made for the fact that Lucy was a good nurse, perhaps arriving well before the start of her shifts and leaving well after.
- Neonatal head Erian Powell testified at trial that Lucy was a good nurse and filed reports about incidents particularly diligently. If this was the case, Lucy would have been associated with more incidents than a nurse who was not as good at reporting incidents.
Appendix 1: MBRRACE calculation methodology in relation to stabilised and adjusted data (from MBRRACE-UK Perinatal Mortality Surveillance Technical Manual Version 1.2)
Jonathan Fletcher, Nov 01, 2023: Hi Peter, Very interesting as always. One source of data which I have come across when looking into this is The National Neonatal Research Database (NNRD) maintained by a team at Imperial College https://www.imperial.ac.uk/neonatal-data-analysis-unit/neonatal-data-analysis-unit/utilising-the-nnrd/. You may have come across it. It has very detailed information about all babies admitted to neonatal units in the UK and allows analysis right down to the neonatal unit level. All of the data is entered by frontline carers within the units and quality checks are then undertaken by the team at Imperial. It is primarily maintained for medical and medical technology research and the extent to which it is covered by FOI is not entirely clear. A committee reviews requests for data on a case by case basis. I haven’t wanted to contact it so far in case it causes political turbulence which might adversely affect Lucy’s situation. But you may have more finely honed instincts on these matters.
© Chimp Investor Ltd


This is excellent, and thoughtfully done. As a criminal lawyer one thing I would note regarding the ten deaths for which Letby wasn’t charged- there may well be suspicion or even (circumstantial) evidence as to her involvement with them, but the prosecutors felt that they could not prove the offence “beyond reasonable doubt”- the very high criminal threshold.
It is quite a common prosecutorial strategy where there are multiple potential charges (even for the most serious crimes like murder and manslaughter) to only include the strongest, for fear that a jury will think “if the accused is not guilty for some, they wouldn’t be guilty for any”.
The point is that it reads as though you have assumed the hospital/ police have decided the other ten deaths have nothing to do with Letby based on no charges being laid.
It may well be that they have decided the deaths don’t have anything to do with her, and your point (1) indicates there must be very good evidence for that. It would be interesting to see the evidence beyond the failure to lay charges.
Your point is well made. I don’t think I say that the reason those ten were not on the charge sheet was because she wasn’t on duty but perhaps I do not make it clear enough that we just don’t know for sure she wasn’t. The below is from the Rachel Aviv piece. And police announced it was looking into incidents at other hospitals i.e. no longer looking at Countess events. Also, we know that with respect to the 25 events that were on the charge sheet, the experts ignored postmortems, the far more likely explanations/diagnoses given the various issues with the babies as set out in the Aviv article. So if Evans recommended another 25 which likely included the other ten deaths, why would experts not have ignored the obvious in those too and invoked some ridiculous account of intentional harm as they did with the 25 that were on the charge sheet?
“Evans identified events that may have been left out, too. He told me that, after Letby’s first arrest, he was given another batch of medical records to review, and that he had notified the police of twenty-five more cases that he thought the police should investigate.”