
Understanding This Will Make You A Better Person
Bayes’ Theorem can be used to make better decisions, whether in the courtroom or the stock market
It is estimated that a human brain is made up of between 100 and 500 trillion trillion of what we call atoms. Arising from the 100-500 trillion trillion atoms that make up your own brain is that familiar feeling of one-ness called ‘you’. How your brain does this is one of the great remaining mysteries.
Thinking about a brain’s function rather than how it works may be easier. Our ‘decisions’, conscious or otherwise, are a function of genetic information passed to us by our parents and non-genetic information that we accumulate after conception. Our decision making systems get continually updated as more information is accumulated. In other words, we learn.
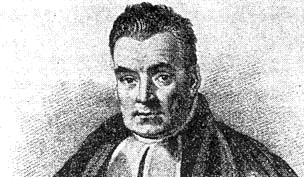
While we take it for granted that we learn, we are generally unaware just how badly we do it at times. Thanks to an 18th century Presbyterian minister named Thomas Bayes, we have a simple tool that can make us aware of the flaws in our learning system, helping us in the process make better decisions.
Bayes’ Theorem is a simple but frustratingly-difficult-to-grasp mathematical formula that calculates how the probability of an event changes when new information/evidence is received. That this is analogous to what the brain does intuitively on a continual basis should be clear.
Here’s an example.
A test for a medical condition occurring in 1 in 1,000 people has a diagnostic accuracy of 95%. You test positive for the condition. What is the probability you have the condition?
Now, what you knew before you had the test was that there was a 1 in 1,000 chance that you had the condition. You then got new information – that you had tested positive. Based on this new information, what is your new probability that you have the condition?
You may, like most, think that it’s 95%. Wrong. It’s 2%.
What you want to know is the probability that you have the condition given that you tested positive. However, the 95% number – the diagnostic accuracy – is not “the probability you have the condition given a positive test” but “the probability of a positive test given you have the condition”. If we denote the event you have the condition, C, and a positive test result, T, we can write the probability you have the condition given a positive test as P(C|T) which is not the same as P(T|C).
A good way to understand the difference is to realise that the probability of an animal having four legs if it is a dog is different to the probability it is a dog if it has four legs. In other words, in the case of the medical test, the 95% number is P(T|C) not P(C|T). Bayes’ Theorem links the two:
P(C|T) = [P(T|C)/P(T)]*P(C)
P(C) is called the prior probability of having the condition, i.e. prior to having the test, 1 in 1,000 or 0.01%. P(C|T) is the posterior probability of having the condition i.e. after having received the test result, which I shall demonstrate is 2%. The information relating to the test result is captured in the square brackets and it is what converts the prior probability to the posterior probability, analogous to how a new piece of information about the world changes our view of the world. However, if your intuition tells you the chance of something is high when it is in fact low, as in the case of the medical test, imagine how that impacts your decision making.
In the case of the medical test, the mistake is to forget that there is a chance you will be incorrectly diagnosed as having the condition if you don’t actually have it, a so-called false positive. If the probability of a false positive is 50 times the probability of a true positive, as I will show is the case, then the ratio of the probability of a false positive to the probability of a true positive is 50:1 or 98%:2%. In other words the probability you have the condition if you test positive is only 2%.
These numbers can be shown graphically:
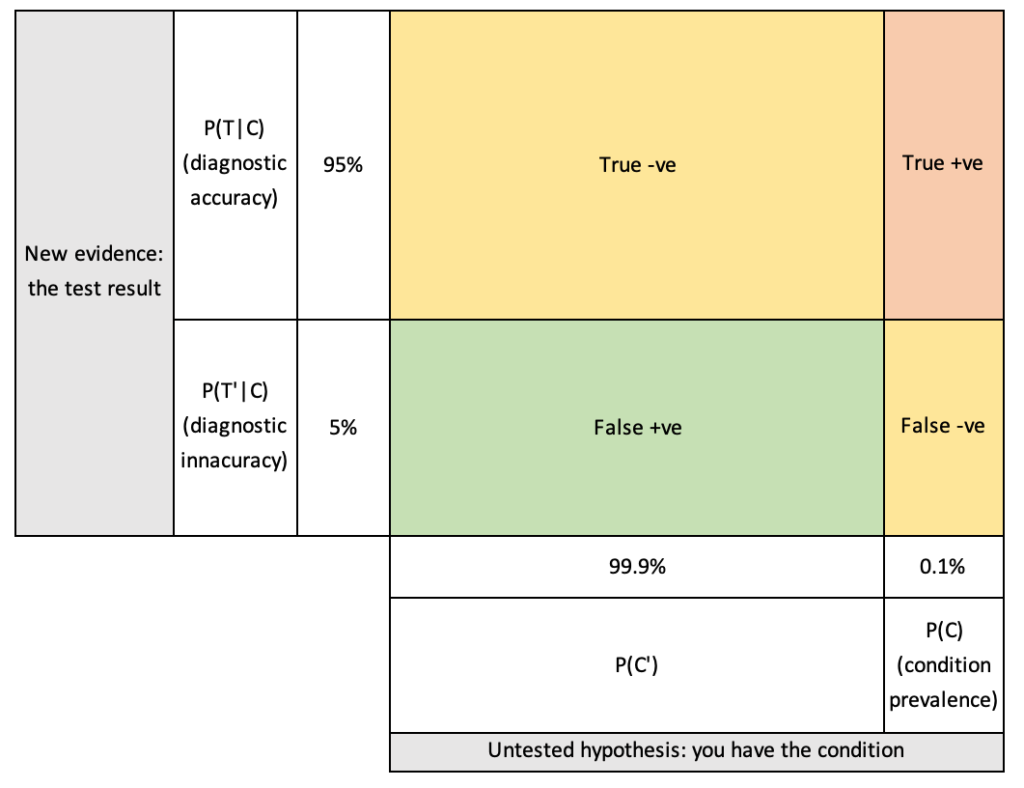
The probabilities relating to the prevalence of the condition (1 in 1,000 people, or 0.1%, have the condition while 999 in 1,000, or 99.9%, don’t) are along the bottom edge of the coloured ‘square’. The probabilities relating to the diagnostic accuracy are along the left edge. (Note that lengths are exaggerated to aid visualisation.) The areas of the green, yellow and red boxes also represent probabilities – to calculate the probability of tossing a head and rolling a six, you multiply one half by one sixth to get one twelfth, or 8%. In other words, a true positive – the red rectangle – is obtained 95% of the time in 0.1% of people or ,95% multiplied by 0.1% equals 0.095%.
Now, we want to know the ratio of the probability of a true positive test result to the probability of a positive test result, true or false. This is the area of the red rectangle as a percentage of the total of the areas of the red and green rectangles. Which is:
0.1% * 95% / (0.1% * 95% + 99.9% * 5%) = 2%.
The moral of the story? Always get a second opinion.
Another area in which intuition tends to be wrong is in the justice system. What jurors are trying to do is determine the probability that the defendant committed the crime of which they are accused given the evidence. However, what jurors often instead think of is the likelihood of the evidence given that the defendant committed the crime. Indeed, prosecutors often present the latter as the former, which is why it is called the prosecutor’s fallacy. The difference between the two can be huge and has resulted in miscarriages of justice in countless actual cases throughout the world, a number of them in the UK.
One tragic case was that of Sally Clark. Her two baby boys both died of sudden infant death syndrome (SIDS). A medical expert however testified that the probability of one such death was 1 in 8,500 and thus that the probability of two was 1 in 73 million (8,500 times 8,500). This was deemed so unlikely that the prosecution said the only possibility was that Clark had murdered her babies.
Now, the 1 in 73 million number is the probability of the evidence assuming innocence. It is not the probability of innocence given the evidence, which must take into account the fact that very few mothers murder their babies – this is the prior probability, equivalent to the medical condition prevalence of 1 in 1,000. However, the jurors made the mistake of thinking that because the probability of the evidence assuming innocence – i.e., the probability both babies had died of SIDS – was so tiny, the possibility of innocence had to be discounted.
As for the 1 in 73 million number, this was only correct if a) the 1 in 8,500 number for one SIDS was correct and b) the two SIDS were independent of each other i.e. 1 in 8,500 could be squared to get 1 in 73 million. It turns out that boys are more susceptible to SIDS than girls so the odds for boys are lower than 1 in 8,500. More importantly, the very real possibility of a genetic factor rendered the two SIDS dependent not independent events – according to a 2004 paper by Salford University Professor of Mathematics Ray Hill that drew on extensive SIDS statistics, “after a first cot death the chances of a second become greatly increased” by a dependency factor of between 5 and 10.
Thus, the probability of two baby brothers falling victim to SIDS may well have been more like 1 in 5 million not 1 in 73 million. To argue that this represented guilt ‘beyond reasonable doubt’ – assuming that ‘beyond reasonable doubt’ means P(guilt|evidence) greater than 99.9% – would have required the prevalence of mothers murdering two of their babies to be quite common, as many as 1 in every thousand or so, clearly absurd. Sally Clark was eventually exonerated after having spent three years in prison but the damage had been done and she died of alcohol poisoning four years later.
The trial of a nurse, Lucy Letby, accused of murdering 7 babies and of a further 15 attempted murders got underway in Manchester two weeks ago. It was clear from the prosecution’s opening remarks that there is no direct evidence – she was not caught in the act. Prosecution evidence has thus far been from medical experts testifying that deaths could not be explained by natural causes. There will also no doubt be roster evidence showing that Letby was on duty at the time of all 22 events. Of course there may well have been other unexplainable events at which Letby was not present, particularly since the hospital in question received a damning report around the time the murders and attempted murders were allegedly taking place about the poor processes in its neonatal unit.
A look at the Websleuths thread about the trial clearly indicates a presumption of guilt among many posting comments. In other words, they are confusing the probability of guilt given the evidence with the probability of the evidence assuming guilt. One must not assume guilt – our justice system is based on the presumption of innocence.
Many of those posting comments are failing to take into account that given a large number of neonatal wards across the country, it is quite likely that one of them will experience an above average number of deaths/collapses – for the same reason, you are never surprised when a lottery is won, though you would be if you won it.
They are failing to take into account the fact that nurses do not tend to murder their patients, in other words that the prior probability is very low.
Let’s hope the defence can do a good job of explaining to the jury the difference between P(A|B) and P(B|A).
It seems inappropriate, after having written about the tragic death of ten babies, to turn to the subject of investing. However, the reason many investors perform poorly is that they do not correctly interpret new information. Mistakes tend to relate to the belief that if the price of a stock or market goes up – i.e. new information – the probability that they will go up further increases. Bayes’ Theorem will tell you that, in general, the opposite is the case.
© Chimp Investor Ltd